Analyse Survey Results

Analysing Survey Results refers to the process of examining the collected data from a survey in order to gain insights, draw conclusions, and make informed decisions. It involves analysing the responses provided by survey participants to extract meaningful information and identify patterns, trends, relationships, and key findings.

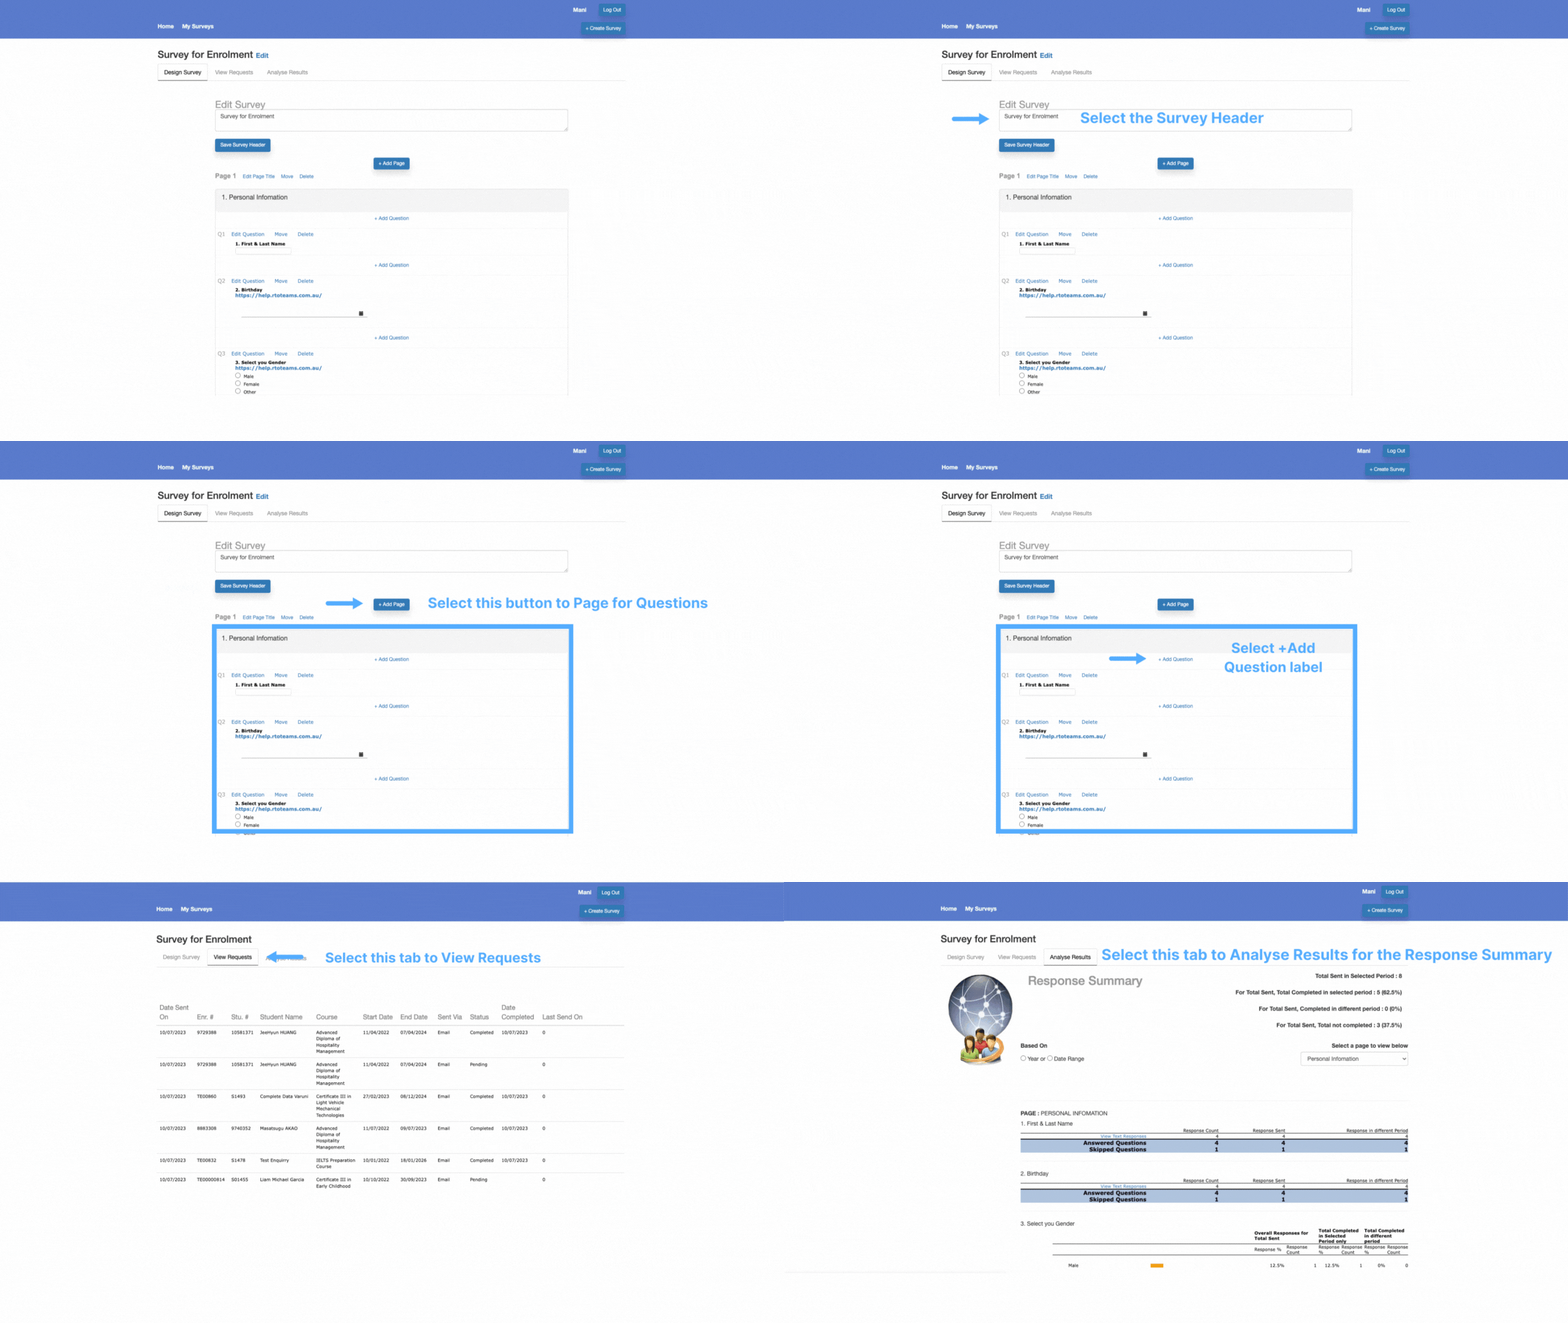
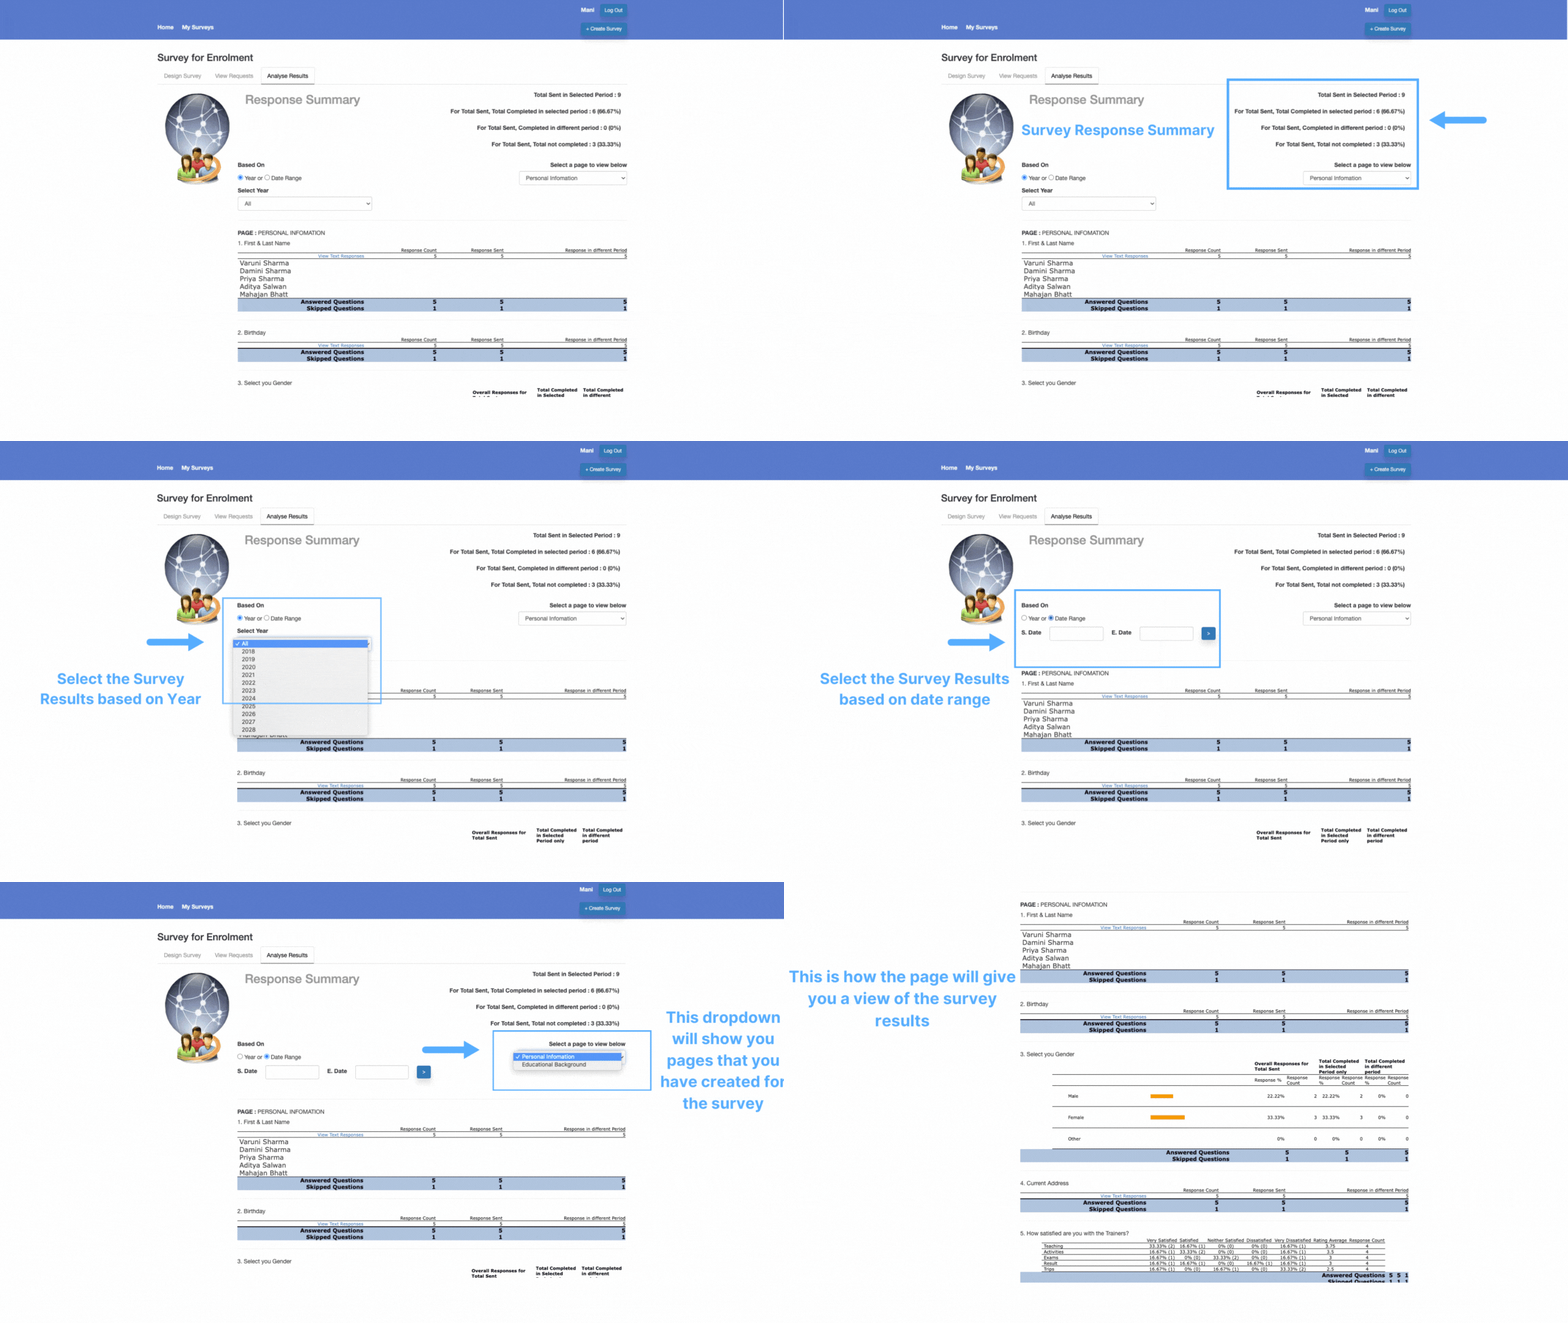
The screen offers you the ability to analyse survey results based on a specific year or date range. It provides a user-friendly interface where you can select the desired timeframe and view results accordingly. In addition, there is a dropdown menu next to the “based on” radio button, which allows users to select specific pages from the survey to focus on when analysing the results.

Upon selecting the desired parameters, you are presented with a summary response section. This section provides key metrics to provide an overview of the survey performance within the selected period. It includes information such as the “Total Sent in Selected Period,” which represents the total number of survey invitations sent during the chosen timeframe. The “Total Completed in Selected Period” indicates the number of surveys that were fully completed within the specified timeframe.

Furthermore, the summary response section also provides insights into completion rates across different periods. This includes information such as “Completed in Different Period,” which shows the number of surveys completed within periods other than the selected timeframe. Additionally, it presents the “Total Not Completed,” which represents the number of surveys that were not completed by respondents.

The availability of these summary response metric assists you in understanding the overall survey engagement and completion rates. By analysing results based on specific timeframes and page selection, you can derive valuable insights into survey performance, identify trends, and assess the effectiveness of the survey design. This helps in making data-driven decisions and improvements based on the survey findings.
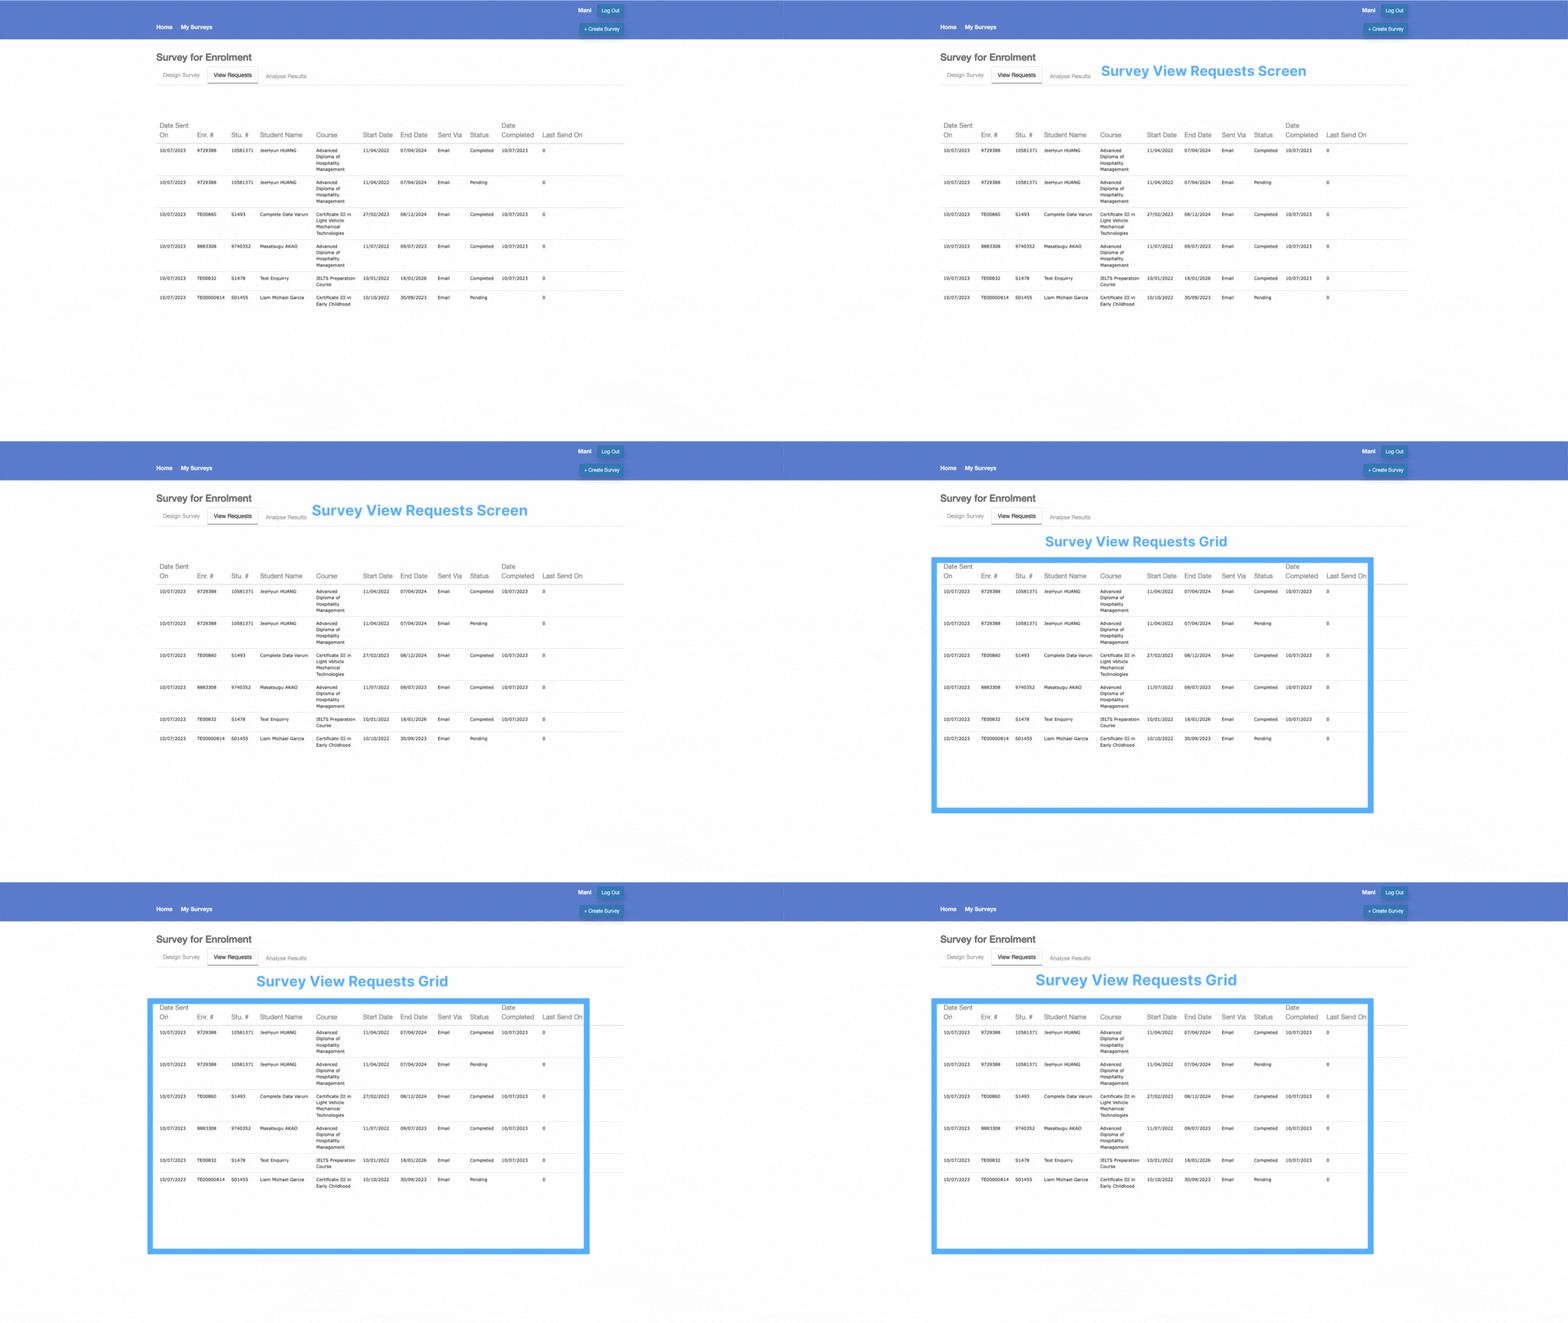
Survey Requests Screen

The Survey View Request screen is a part of the survey management interface that displays a grid list of survey requests received from students. This screen provides essential information related to each request in a structured format. The grid typically includes details such as the date the request was sent, the student’s name, enrolment number, course name, enrolment dates, and status of the request.

By presenting survey requests in a grid, you can easily access and review the basic information associated with each request. This information allows you to track the progress of survey participation, identify specific participants, and gather essential demographic details such as the student’s name, enrolment number, and course name. Additionally, the enrolment dates and status information provided in the grid help in managing and monitoring the survey process.

This screen also serves as a central hub where you can view and manage the requests received from students. It offers a convenient overview of the survey participant pool, enabling efficient tracking and organisation of survey data. This screen plays a crucial role in ensuring that survey requests are properly tracked, managed, and processed, facilitating effective data collection and analysis.

Survey Designer Screen

Survey design refers to the process of creating and structuring a questionnaire or survey instrument to collect data from students. It involves various considerations such as determining the survey objectives, selecting appropriate question types, formulating clear questions, designing the survey flow, and deciding on the survey delivery method.

The survey management interface consists of different tabs, each offering distinct functionalities and screens. The “Design Survey” tab allows users to create and customise surveys. Within this tab, there are various screens where users can define survey header, select question types and structure the survey flow, and determine response options. Additionally, the “View Requests” tab provides a screen where users can manage and view survey submissions or participant requests. Another important tab is the “Analyse Results” tab, which offers screens specifically designed for survey data analysis.

Design Survey Tab

Designing a survey involves several key steps.

  • Firstly, it’s important to define and add the questionnaire in the Survey header.
  • Next, select the +Add Page button to add the appropriate question types, such as multiple-choice, rating scales, or open-ended questions, should be selected based on the desired data.
  • Structuring the survey flow involves arranging questions logically, considering grouping, skip patterns, or branching logic to tailor the survey experience.
  • Response options need to be determined, ensuring they cover all possible answers or providing an other option when necessary.
  • Once the responses are collected, data analysis is performed using appropriate statistical methods or qualitative analysis techniques to derive insights and draw conclusions.

View Requests Tab

This tab will show you the Survey Request for a particular object. To Know more Please select Survey Request.

Analyse Results Tab

Analysing survey results refers to the process of examining and interpreting the data collected from a survey to gain insights, draw conclusions, and make informed decisions. It involves summarising and examining the responses provided by survey respondents to identify patterns, trends, relationships, and key findings. To know more please select Analyse Results.

Survey

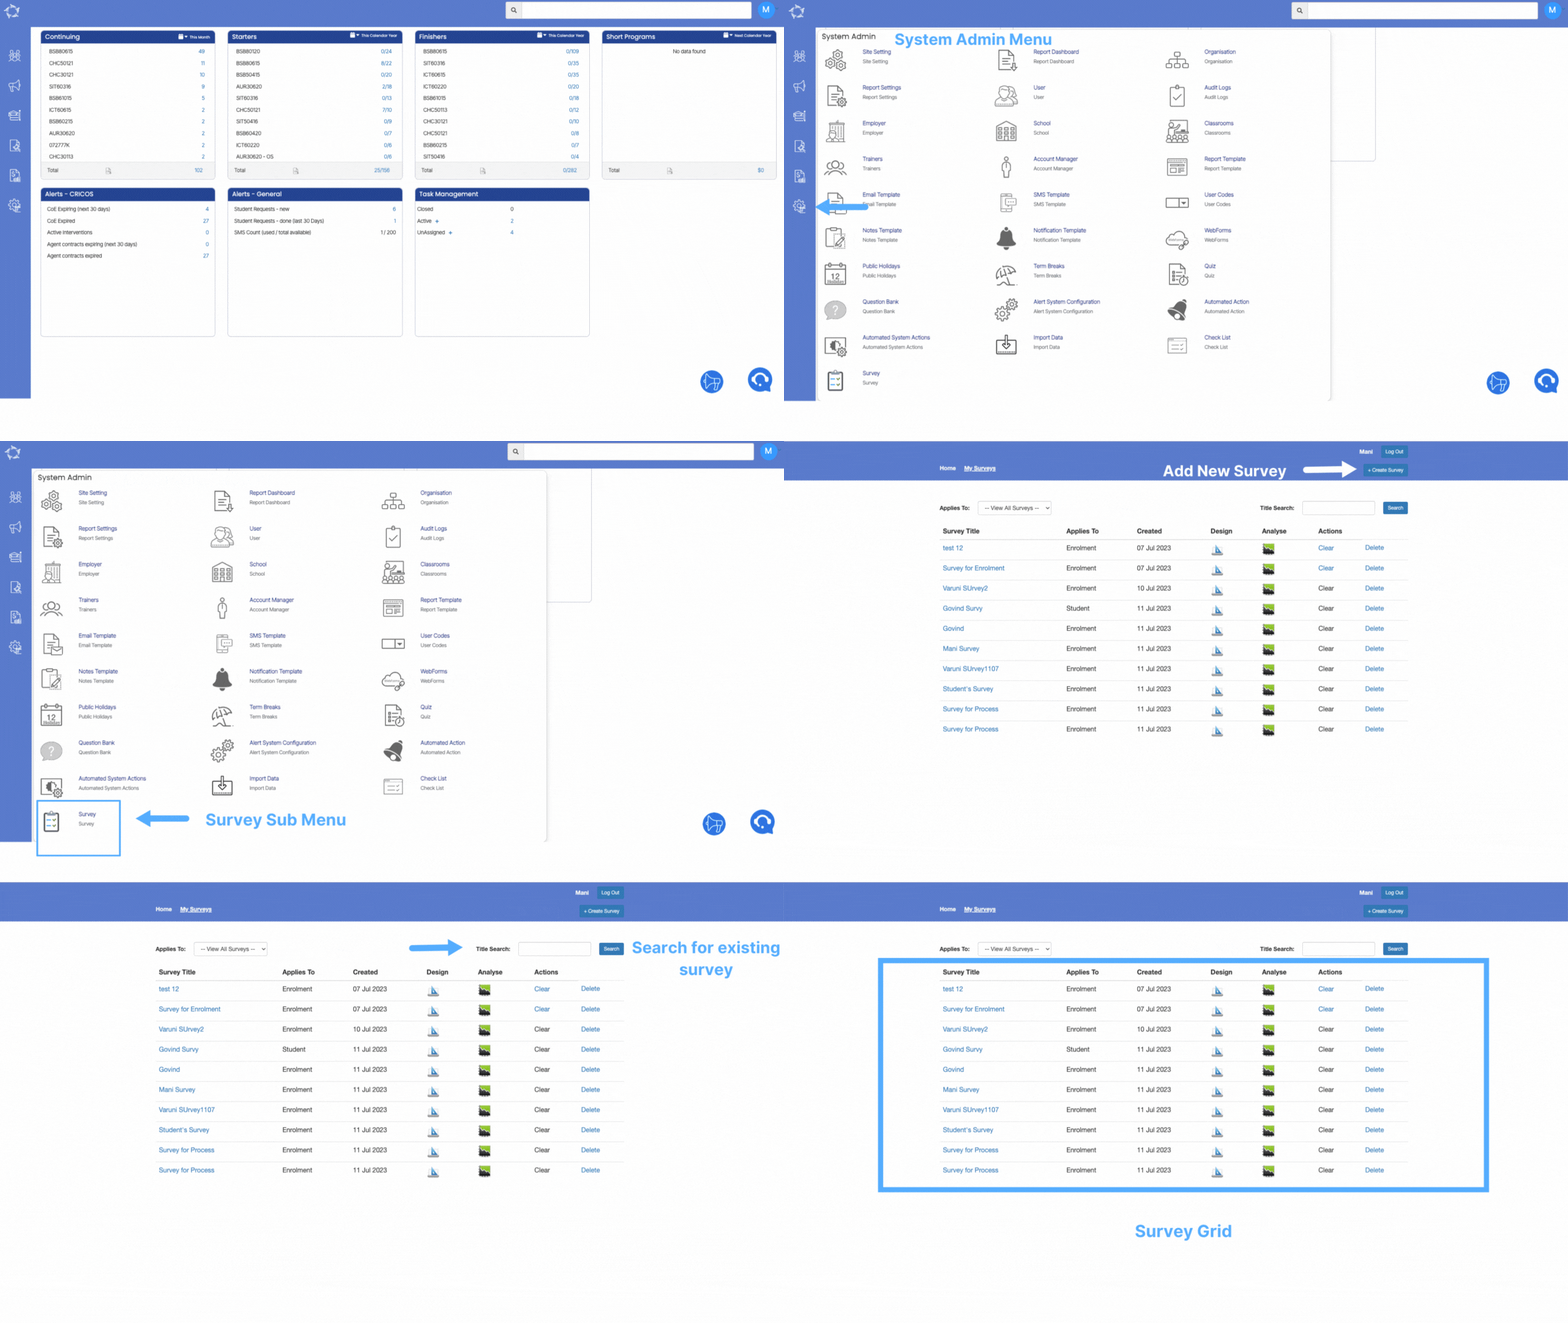
Main Dashboard > System Admin Menu > Survey

We have introduced a new screen called Survey in our system. This addition enhances the functionality and capabilities of our system, providing you with a dedicated platform for creating, administering, and managing surveys.

A survey refers to a research method used to gather information and feedback from students, faculty, and staff within the college of your RTO. Surveys serve various purposes, such as assessing student satisfaction, gathering feedback on courses or programs, measuring faculty performance, evaluating campus services, or conducting research on specific topics related to the college environment.

Surveys are designed to collect quantitative or qualitative data through a set of structured questions. These questions can cover a wide range of topics, including academic experiences, campus facilities, student support services, campus culture, extracurricular activities, and overall satisfaction. The survey design may incorporate different question types, such as multiple-choice, Likert scales, open-ended questions, or rating scales, depending on the research objectives and the information sought.

When you are on the Survey panel screen, you will be presented with the Icons, buttons and surveys in the grid. Please see the below table for more.

Fields/Icon/ButtonsExplanations
HomeWhen you select the Home, it will take you back to the Main Dashboard.
My SurveysUpon selecting this, you will be presented with all the surveys under your user name.
Applies ToThis is a user code and you can create the user code as per your requirements. For example – Students,Enrolments etc.
Title SearchThis field will help you to search for the specific survey by selecting the search button.
Gridthe grid will display all the survey as a list and also gives you relevant information such as, Applies to, date created, design, Analyse and actions such as whether you want to clear or delete the survey.
LogoutUpon selecting this button, the system will log you out from TEAMS.
+Create SurveyWhen you select this button, you will taken to the create survey step 1 screen.

Create Survey Step 1

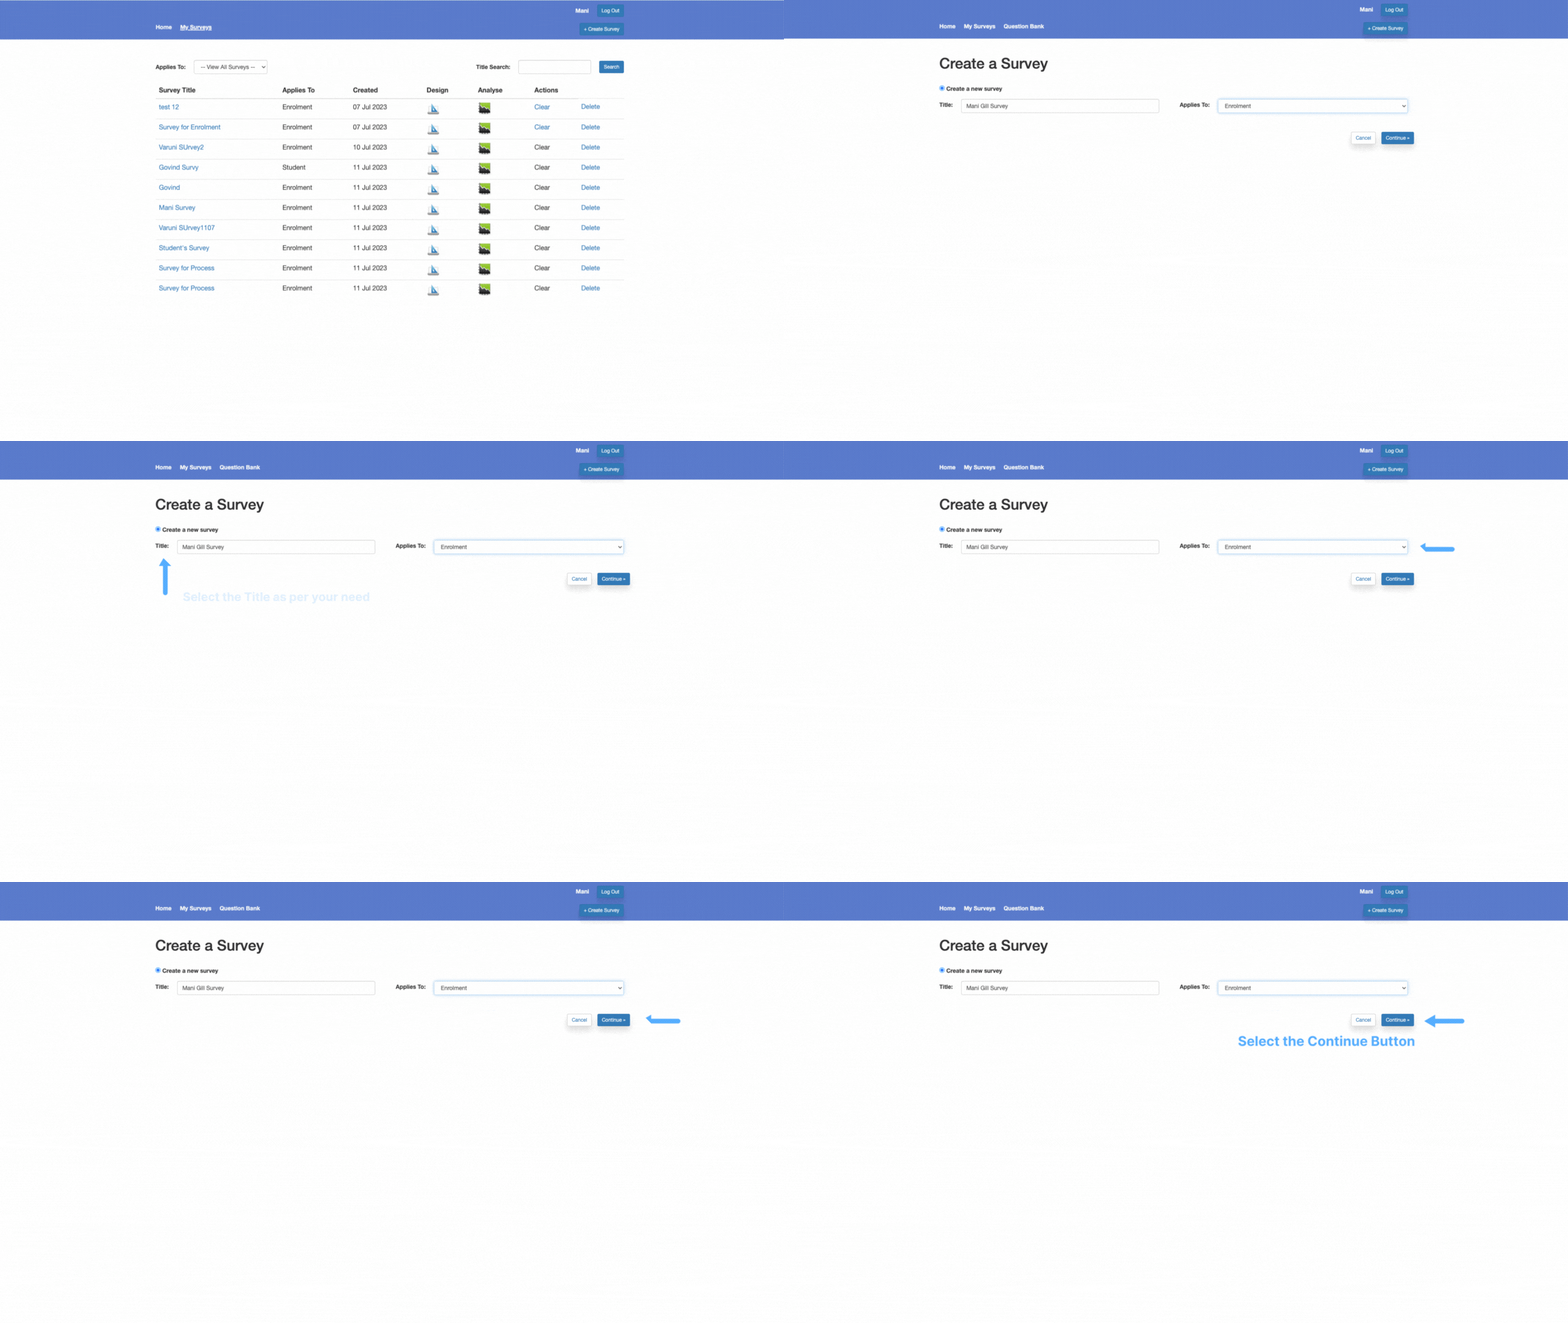
When you select the + Create Button from the Survey Panel screen, the system will takes you to the create survey step screen. This screen will allow you to create a new survey in the system. You will be presented with the create a new survey radio button following the Title and Applies to fields.

  • Title – This can be anything as per your requirements.
  • Applies to – This is a user code in TEAMS, and based on the User Code created, the dropdown will show you the options accordingly.

In the header of the screen, the Home label will takes you back to the TEAMS Main Dashboard, My Surveys label will open the Survey Panel screen for you and the question Bank will take you to the Question Bank Screen.

Once you select the Continue button, the system will take you to the Survey Designer screen.

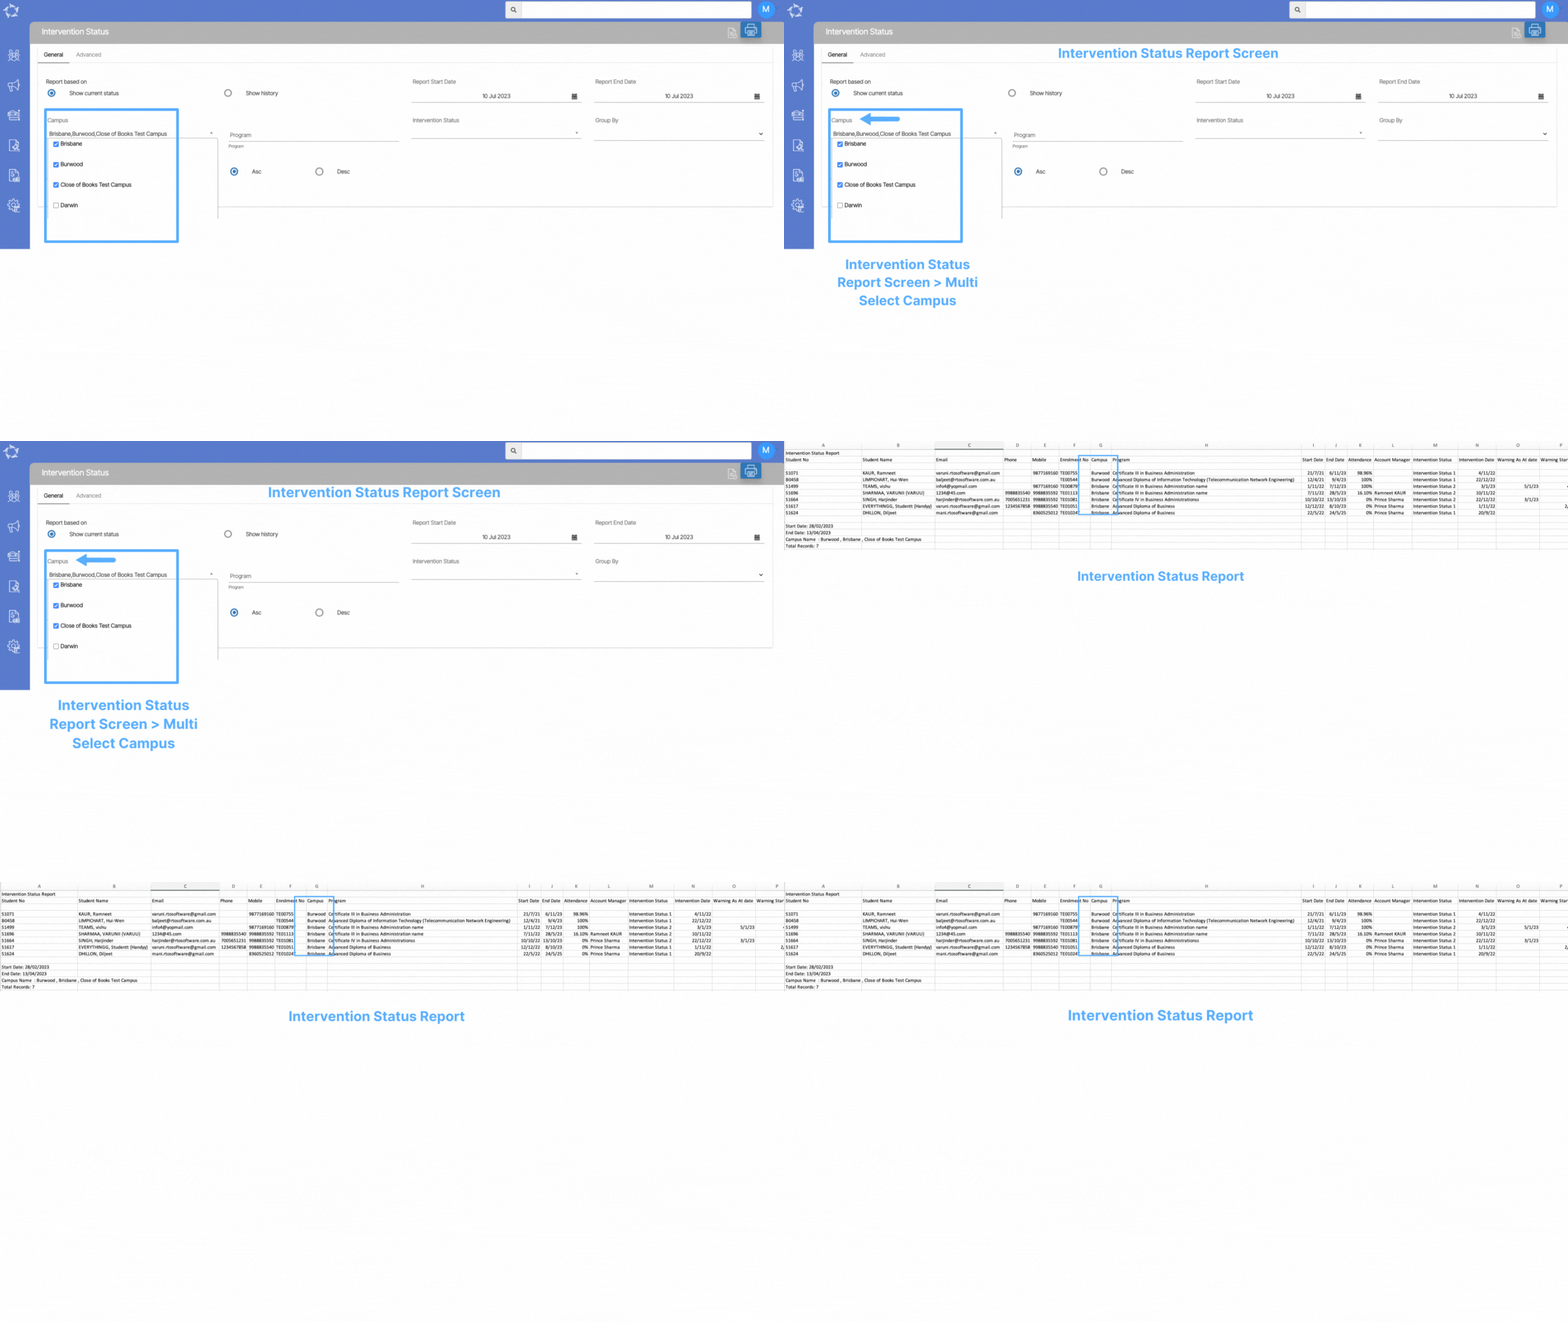
Intervention Status report – Campus Dropdown Changes

Previously, when generating the Intervention Status Report, the system allowed you to select only one campus at a time from the campus dropdown menu. However, we have now made important changes to this feature. The campus dropdown menu has been transformed into a multi-select option, giving you the flexibility to select multiple campuses when generating this report. This improvement provides increased convenience and efficiency, as you can now generate report for multiple campuses in a single operation.

With the new multi-select capability, you can easily include data from different campuses in the Intervention Status Report, enabling a more comprehensive and holistic view of student progress and intervention efforts across various locations.

We believe that this enhancement will greatly benefit you, offering greater flexibility and enabling more efficient reporting processes.

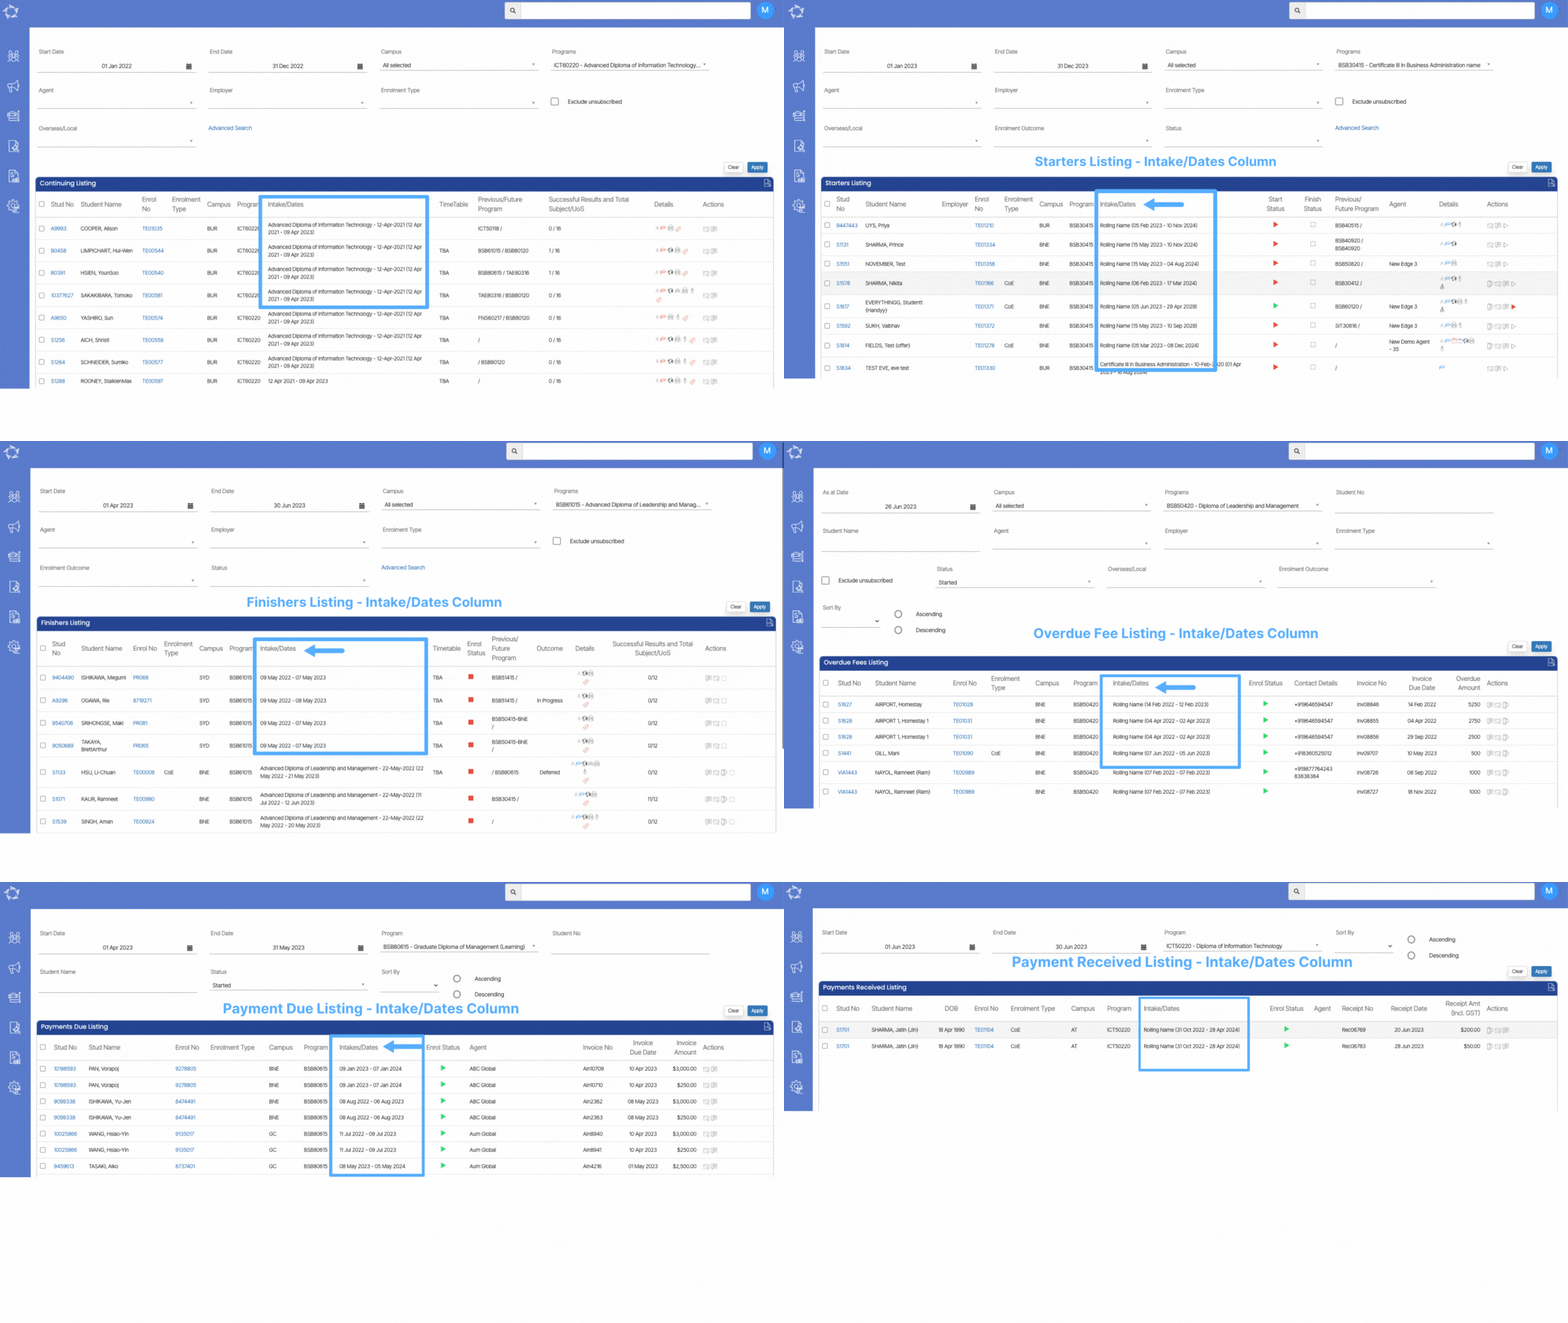
Listing Screens – Intake/Dates Column Changes

We are excited to announce that we have implemented updates to the Intake/Dates Column across all listing screens, including Continuing, Starters, Finishers, and Financial Dashboard > Overdue Fee Listing, Payment Due Listing and Payment Received Listing. Previously, the system would display enrolment dates only if there was no linkage to an intake.

With the recent changes, the Intake/Dates Column now provides more comprehensive information. If the enrolment is linked with an intake, the column will display both the intake name and the enrolment dates. On the other hand, if there is no intake linkage, you will only see the enrolment dates without the intake name. This enhancement allows for a clearer representation of enrolment details, providing you with a better understanding of the associated intake and enrolment dates.

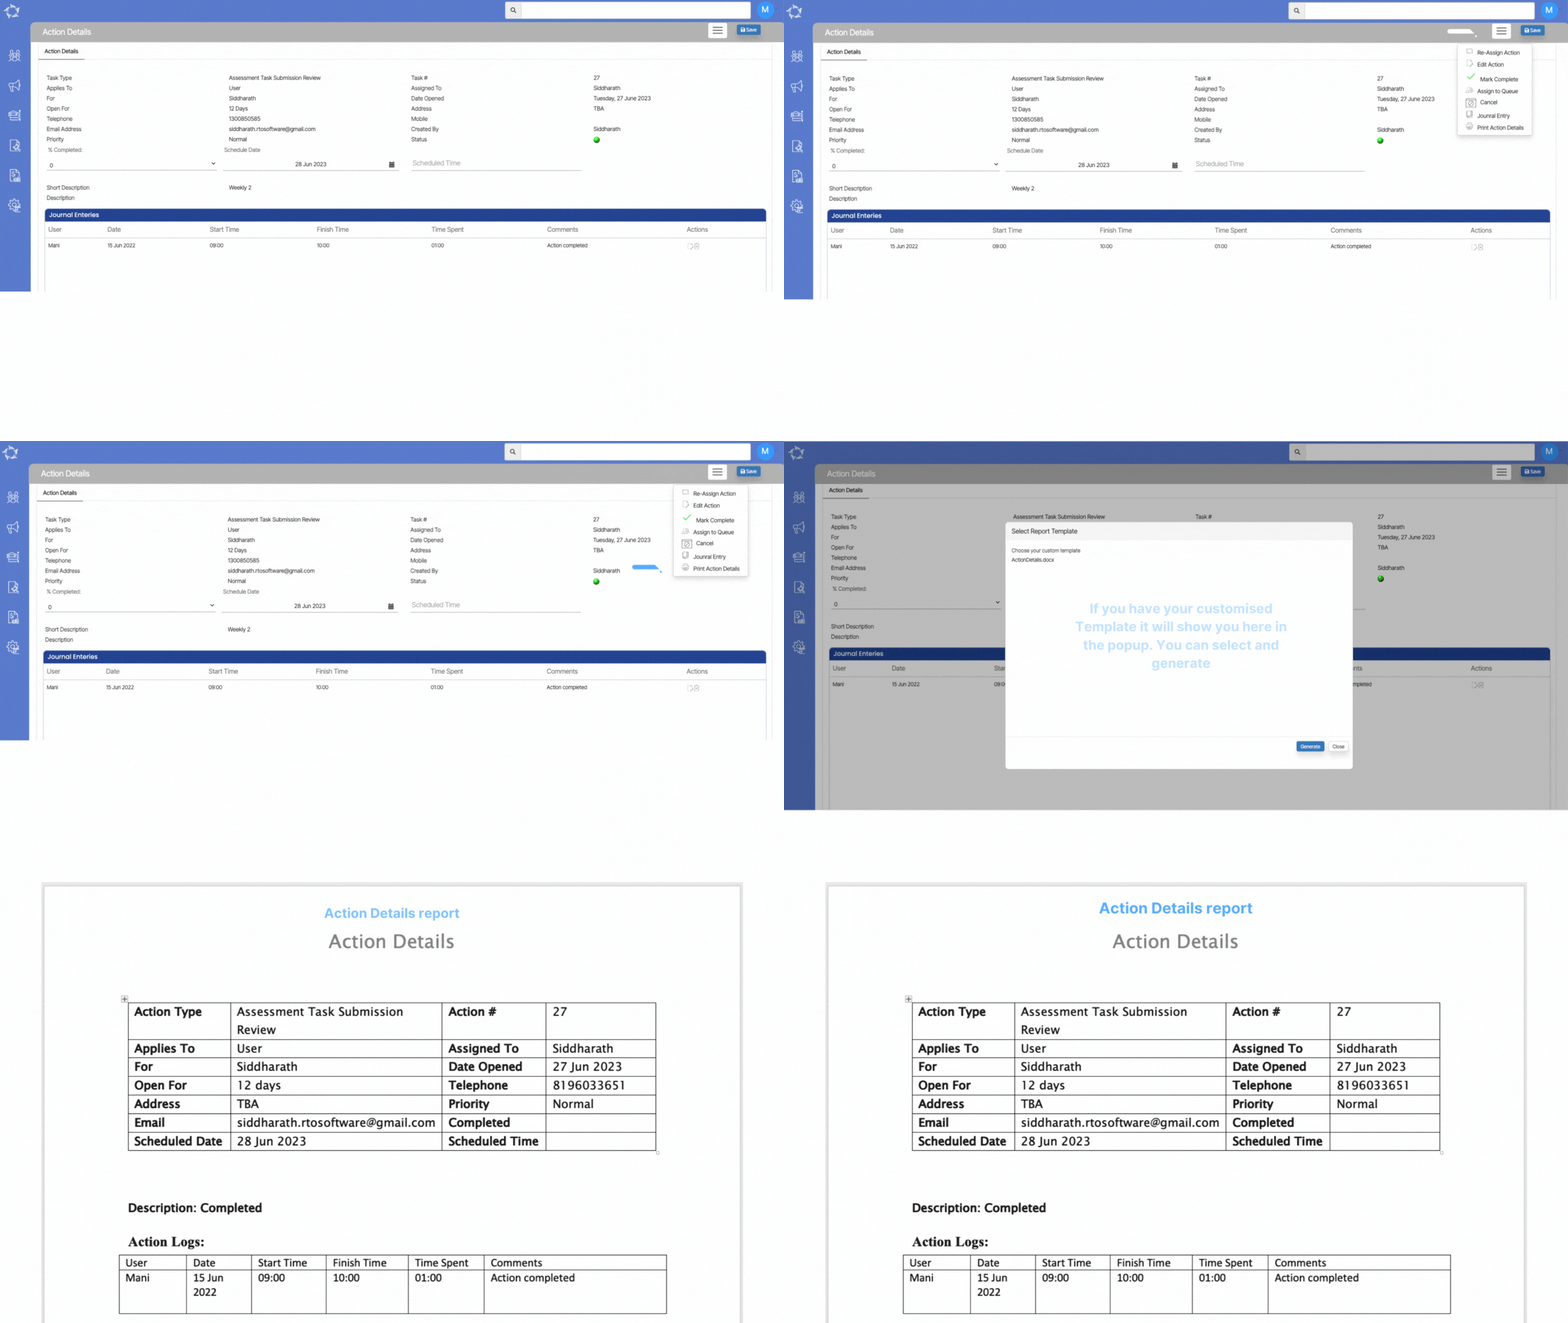
Task Management – Action Details New Report

We are pleased to inform you that a new report called the Action Details Report has been added to our system. To access this report, navigate to the Action Details Screen and select the Burger menu. The report provides a comprehensive view of all the details associated with tasks created from the Task Entry Screen. Additionally, it includes action logs for Journal Entries. When you generate the report, it will be available in both Word and PDF formats.

If you wish to customise the template according to your specific requirements, you can easily do so by selecting the Report Template option. We have provided guidelines in a separate post on How to customise the Report template in TEAMS. This feature allows you to tailor the report template to align with your preferences and needs, providing you with greater flexibility and control over the generated reports.

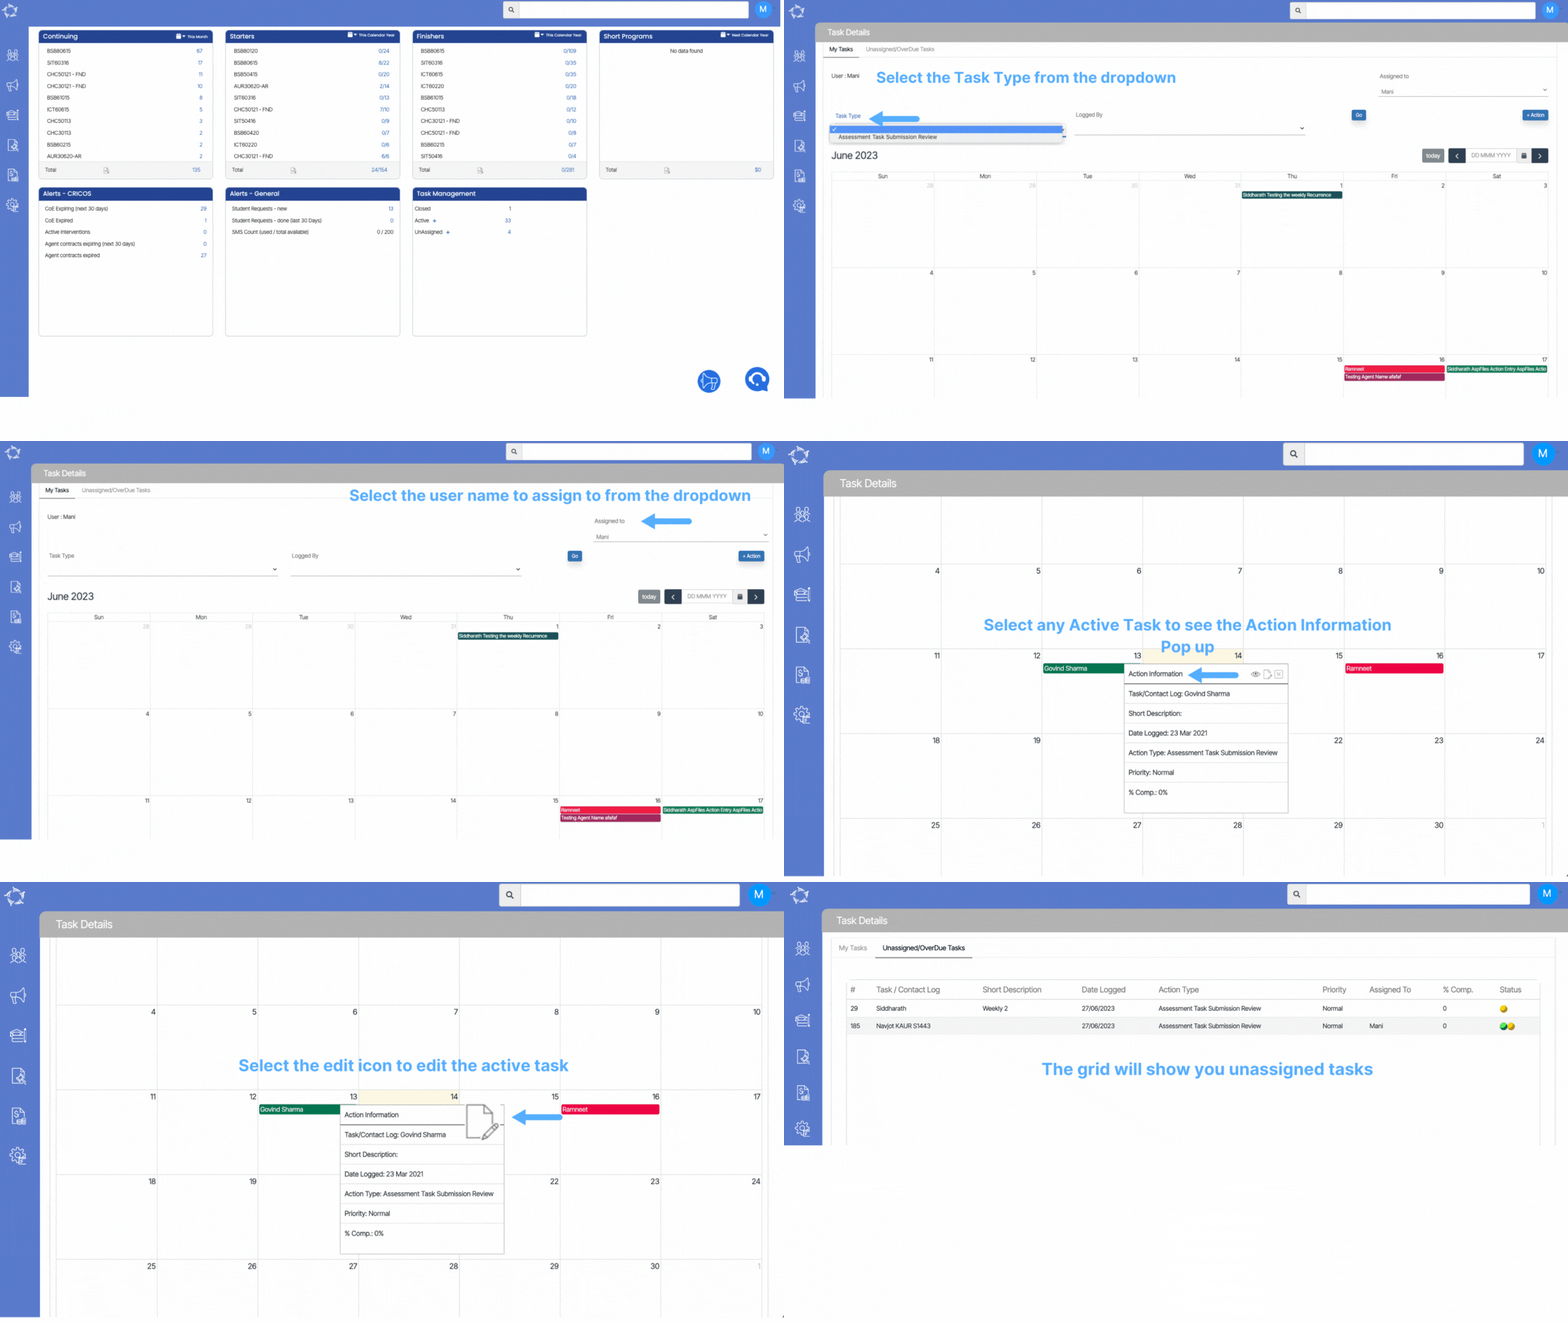
Task Management – Active Tasks – Task Details screen

By selecting the Active Tasks hyperlink number, users are directed to the Task Details screen, which provides a comprehensive overview of all active tasks in the calendar, as well as unassigned tasks. The screen is divided into two tabs: My Tasks and Unassigned/overdue Tasks, offering efficient task management.

Under the My Tasks tab, users can easily handle their tasks using various filters such as Task Type and logged or assigned names from the dropdown menu. This allows for quick searching of active tasks. Additionally, users can preview task details, make necessary edits, or delete tasks as needed. This functionality empowers users to review and modify their task list seamlessly, promoting an organized approach to task management.

The Unassigned/overdue tasks tab presents a grid displaying all unassigned and overdue tasks. The grid provides relevant information such as task description, logged date, action type, priority, and task status (pending or completed). This tab helps users stay informed about pending tasks and ensures timely completion.

To add a new task to the system, users can simply select the +Action Button located on the right-hand side of the screen, which will redirect them to the Actions Entry screen. This streamlined process allows for the easy creation of new tasks into the system, facilitating efficient task management and ensuring all necessary actions are accounted for.

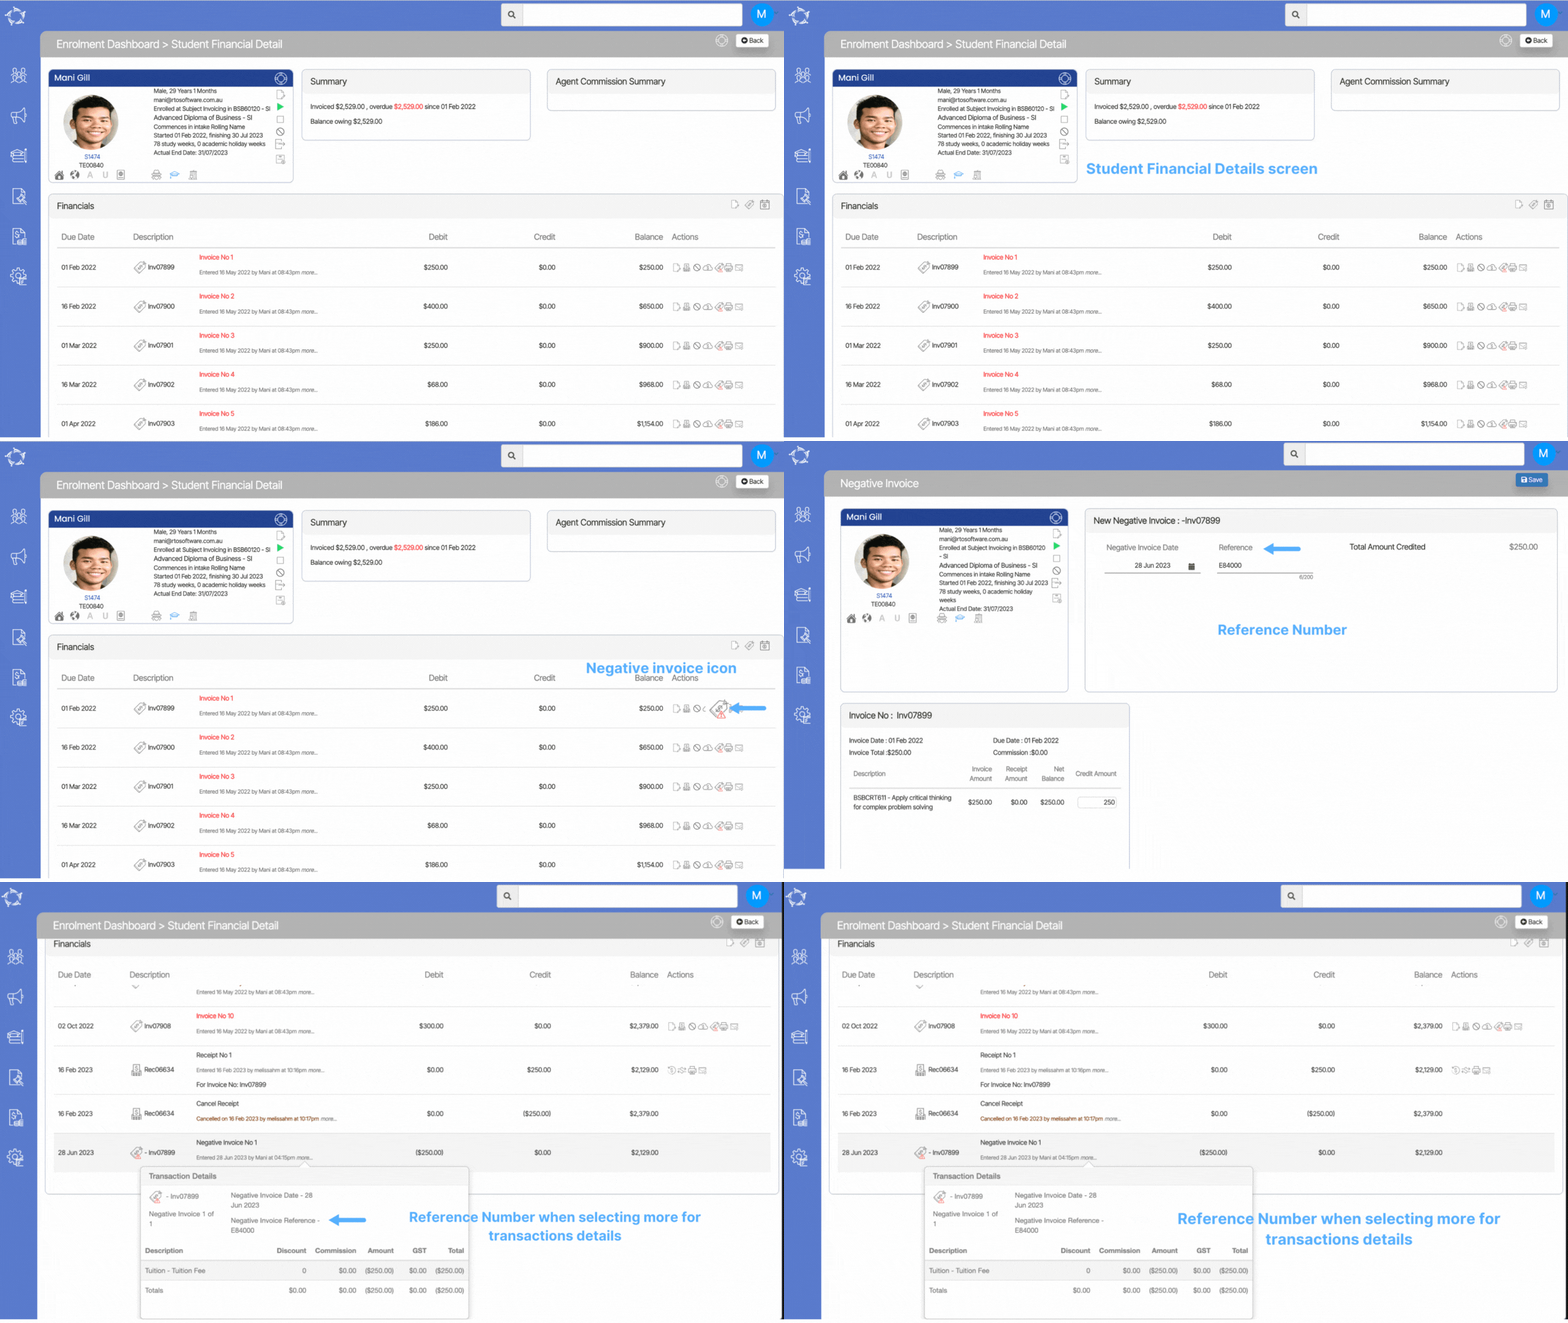
Negative Invoice Reference – New Label

We are pleased to announce the addition of a new label called Negative Invoice Reference on the Student Financial Details screen. This label can be found within the Transactions Details pop-up, under the More option. The purpose of this enhancement is to provide you with a convenient way to associate a reference number with negative invoices.

When creating a negative invoice and specifying a reference number for it, the system will now display this Negative Invoice Reference Number in the Transactional Details section for that particular invoice. This feature enables you to easily track and reference negative invoices, streamlining financial management processes and ensuring clarity and accuracy in accounting practices.

We believe that this enhancement will contribute to better financial management and provide you with an improved and more comprehensive view of your student financial details.