Webform – Redesigned Agent Section

We have undertaken a redesign of the agent section within the webform, introducing notable improvements. Previously, this section solely displayed agents already present in your database. However, we’ve now introduced a valuable addition in the form of a checkbox labeled “Agent not in the list.

Upon selecting this checkbox, the web form interface presents two distinct fields: Agent Code and Agent Name. These fields become mandatory when dealing with new agents that aren’t yet within the system. This enhancement streamlines the process of incorporating new agent information by allowing you to promptly update the agent’s code and name.

Following the completion and submission of the web form for the applicant, you’ll find a convenient pathway to access this information. Specifically, within the Applicant Dashboard under the Profile tile, a Webform Icon is available. Upon selecting this icon, you’ll encounter the new agent code and name, along with the “Agent not in the list” checkbox, ensuring seamless tracking and management of agent-related details within the TEAMS system.

Report Dashboard – Optimisation

The Report Dashboard has undergone recent enhancements aimed at improving your experience. Notably, these changes have led to a significant reduction in the processing time required for generating reports.

With the implementation of this latest enhancement, the need for repetitive screen refreshing when generating reports within the Report Dashboard has been eliminated. A novel addition to the system is the introduction of a process icon, which effectively indicates the ongoing processing of the report. This dynamic icon persists until the report generation is complete. Subsequently, you are presented with a download icon for the generated report.

Email Template Screen – New Font Size Option

We are pleased to announce that a new font size option has been implemented on the Email Template Screen. With this latest enhancement, you now have the ability to adjust your font size seamlessly, allowing you to switch between smaller and bigger font sizes effortlessly.

This new feature offers increased flexibility and customisation for your email templates, ensuring that you can tailor your messages to suit your preferences and needs. Whether you prefer a more compact font or a larger, more prominent one, the choice is now yours.

Survey Data Export

Main Dashboard > System Admin Menu > Survey Data Export

A survey export report contains the results and responses collected from a survey. When you conduct a survey, whether it’s through online survey platforms, the data is typically compiled and can be exported into a more manageable and analysable format.

How to generate survey data Export in TEAMS?

Firstly, you need to go to Main Dashboard > System Admin Menu > Survey Data Export. When you select the Survey Data Export sub menu, the system will take you to the filters /parameters screen. from this screen, you can select the required filters and generate the survey data export. Please see the below table that will give you the filter’s explanation.

Filters/ParametersExplanation
Survey TypeThe Survey Type is a User Code and one can create them from the user code screen in TEAMS. You can select the Survey Type from the dropdown. For example Enrolment, Employers etc.
SurveyWhen you select the Survey Type, the Survey dropdown will show you the name of the users.
Year of ExportSelect the year from the dropdown as you required.
CampusThis is a multiselect dropdown and if you have multiple campuses, you can select them from the dropdown.
ProgramsThis is a multiselect dropdown and you can select the programs by selecting the tick boxes against them from the dropdown
Email AddressThis field will display your email address
Export ButtonWhen you select this button, you will be taken to the Survey Export log screen. When you are on this screen, you need to select the Click here to Download the file label to download your Survey export.

How to send Pay Request Email for Invoices?

1. When you are on the Application Dashboard or Enrolment Dashboard > Student Financial Screen, you need to select the pin payment icon 
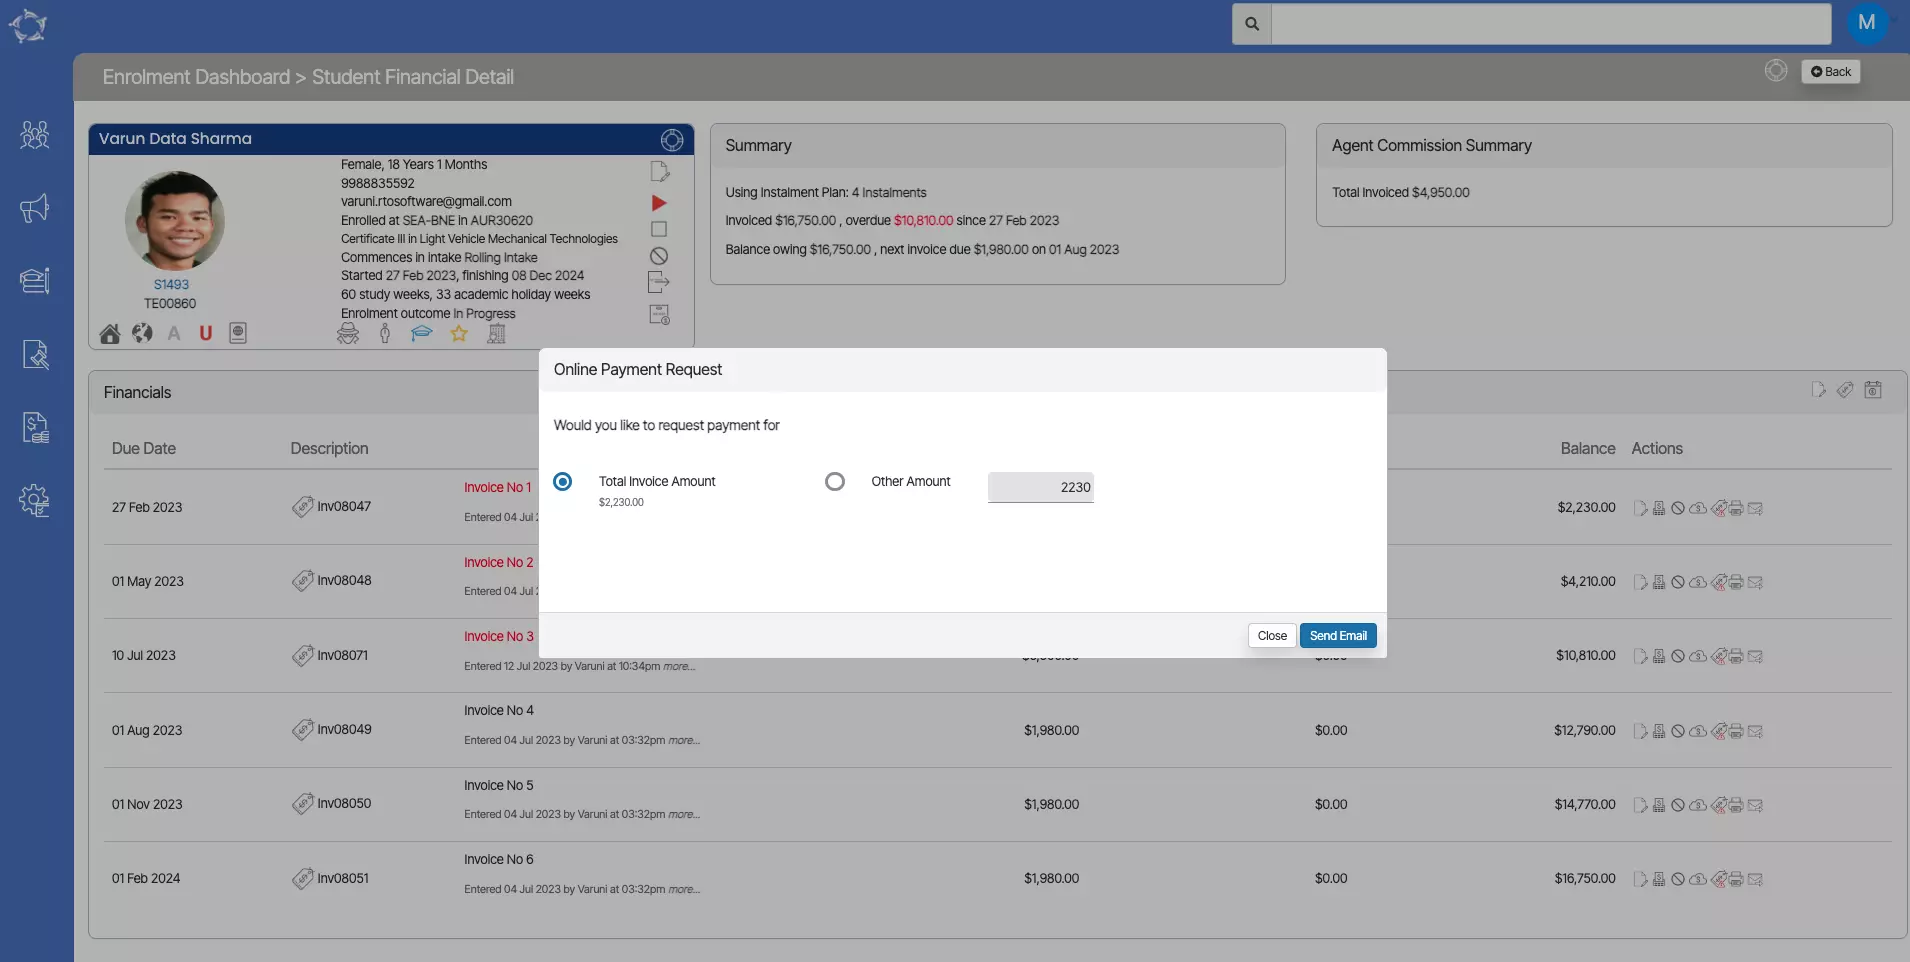
as shown below from the student financial screen.

2. Upon selecting this icon, the system will show you a pop window namely Online Payment Request where you will be presented with two radio buttons:-

Total Invoice Amount – This radio button will show you the total amount of the invoice.

Other Amount – This radio button will allow you to add payment amounts as per your need.

3. Once, you have selected your desired radio button, select the Send Email button and then you will be directed to Compose Email screen. When you are on the Compose Email screen. Select the Template type for the pin payment that you have customised from the email template entry screen. As you can see below the email template type has been selected as Payment. once you have selected it select the send button to send the email.

4. Once the email has been sent to students, they will receive a unique link as you can see in the below email screen shot.

5. This is how the browser will open when the student selects the link.

6. Once the Student paid the invoice online then you will receive a receipt as below:-

How to setup Pin Payment Email Template in TEAMS

To set up an Email Template for Pin Payments you need to follow the below steps

1. Go To TEAMS > Main Dashboard > System Admin Menu > Email Template Icon.

2. Select the +Email template Button on the Email template Welcome Screen.

3. On the Email Template Entry Screen, you need to select the Email Title and Email Subject (please note that these two are mandatory to select and they can be left blank). On the other hand, you need to select Template Type and available Merge Field from their respective dropdowns.

Template Type – While creating the template for Pin Payments, you need to select the template from the dropdown as Payments.

Available Fields – This is an important and mandatory merge field PaymentURL and you can select it from this drop dropdown. (Please note that when you select this merge field while creating the email template and then send the email to students then TEAMS will generate the unique URL where students can click pay online).

4. Once all the above steps are done, select the Save button to save the Email Template.

Analyse Survey Results

Analysing Survey Results refers to the process of examining the collected data from a survey in order to gain insights, draw conclusions, and make informed decisions. It involves analysing the responses provided by survey participants to extract meaningful information and identify patterns, trends, relationships, and key findings.

The screen offers you the ability to analyse survey results based on a specific year or date range. It provides a user-friendly interface where you can select the desired timeframe and view results accordingly. In addition, there is a dropdown menu next to the “based on” radio button, which allows users to select specific pages from the survey to focus on when analysing the results.

Upon selecting the desired parameters, you are presented with a summary response section. This section provides key metrics to provide an overview of the survey performance within the selected period. It includes information such as the “Total Sent in Selected Period,” which represents the total number of survey invitations sent during the chosen timeframe. The “Total Completed in Selected Period” indicates the number of surveys that were fully completed within the specified timeframe.

Furthermore, the summary response section also provides insights into completion rates across different periods. This includes information such as “Completed in Different Period,” which shows the number of surveys completed within periods other than the selected timeframe. Additionally, it presents the “Total Not Completed,” which represents the number of surveys that were not completed by respondents.

The availability of these summary response metric assists you in understanding the overall survey engagement and completion rates. By analysing results based on specific timeframes and page selection, you can derive valuable insights into survey performance, identify trends, and assess the effectiveness of the survey design. This helps in making data-driven decisions and improvements based on the survey findings.

Survey Requests Screen

The Survey View Request screen is a part of the survey management interface that displays a grid list of survey requests received from students. This screen provides essential information related to each request in a structured format. The grid typically includes details such as the date the request was sent, the student’s name, enrolment number, course name, enrolment dates, and status of the request.

By presenting survey requests in a grid, you can easily access and review the basic information associated with each request. This information allows you to track the progress of survey participation, identify specific participants, and gather essential demographic details such as the student’s name, enrolment number, and course name. Additionally, the enrolment dates and status information provided in the grid help in managing and monitoring the survey process.

This screen also serves as a central hub where you can view and manage the requests received from students. It offers a convenient overview of the survey participant pool, enabling efficient tracking and organisation of survey data. This screen plays a crucial role in ensuring that survey requests are properly tracked, managed, and processed, facilitating effective data collection and analysis.

Survey Designer Screen

Survey design refers to the process of creating and structuring a questionnaire or survey instrument to collect data from students. It involves various considerations such as determining the survey objectives, selecting appropriate question types, formulating clear questions, designing the survey flow, and deciding on the survey delivery method.

The survey management interface consists of different tabs, each offering distinct functionalities and screens. The “Design Survey” tab allows users to create and customise surveys. Within this tab, there are various screens where users can define survey header, select question types and structure the survey flow, and determine response options. Additionally, the “View Requests” tab provides a screen where users can manage and view survey submissions or participant requests. Another important tab is the “Analyse Results” tab, which offers screens specifically designed for survey data analysis.

Design Survey Tab

Designing a survey involves several key steps.

  • Firstly, it’s important to define and add the questionnaire in the Survey header.
  • Next, select the +Add Page button to add the appropriate question types, such as multiple-choice, rating scales, or open-ended questions, should be selected based on the desired data.
  • Structuring the survey flow involves arranging questions logically, considering grouping, skip patterns, or branching logic to tailor the survey experience.
  • Response options need to be determined, ensuring they cover all possible answers or providing an other option when necessary.
  • Once the responses are collected, data analysis is performed using appropriate statistical methods or qualitative analysis techniques to derive insights and draw conclusions.

View Requests Tab

This tab will show you the Survey Request for a particular object. To Know more Please select Survey Request.

Analyse Results Tab

Analysing survey results refers to the process of examining and interpreting the data collected from a survey to gain insights, draw conclusions, and make informed decisions. It involves summarising and examining the responses provided by survey respondents to identify patterns, trends, relationships, and key findings. To know more please select Analyse Results.

Survey

Main Dashboard > System Admin Menu > Survey

We have introduced a new screen called Survey in our system. This addition enhances the functionality and capabilities of our system, providing you with a dedicated platform for creating, administering, and managing surveys.

A survey refers to a research method used to gather information and feedback from students, faculty, and staff within the college of your RTO. Surveys serve various purposes, such as assessing student satisfaction, gathering feedback on courses or programs, measuring faculty performance, evaluating campus services, or conducting research on specific topics related to the college environment.

Surveys are designed to collect quantitative or qualitative data through a set of structured questions. These questions can cover a wide range of topics, including academic experiences, campus facilities, student support services, campus culture, extracurricular activities, and overall satisfaction. The survey design may incorporate different question types, such as multiple-choice, Likert scales, open-ended questions, or rating scales, depending on the research objectives and the information sought.

When you are on the Survey panel screen, you will be presented with the Icons, buttons and surveys in the grid. Please see the below table for more.

Fields/Icon/ButtonsExplanations
HomeWhen you select the Home, it will take you back to the Main Dashboard.
My SurveysUpon selecting this, you will be presented with all the surveys under your user name.
Applies ToThis is a user code and you can create the user code as per your requirements. For example – Students,Enrolments etc.
Title SearchThis field will help you to search for the specific survey by selecting the search button.
Gridthe grid will display all the survey as a list and also gives you relevant information such as, Applies to, date created, design, Analyse and actions such as whether you want to clear or delete the survey.
LogoutUpon selecting this button, the system will log you out from TEAMS.
+Create SurveyWhen you select this button, you will taken to the create survey step 1 screen.